Monitoring GNU/Linux UltraSPARC systems using Prometheus
Prometheus and Grafana, running in Docker (using docker-compose) are how I monitor my systems.
For GNU/Linux on x86 hardware all data is scraped by Prometheus from node_exporter instances running on each machine. Unfortunately node_exporter is written in Go, which does not support the UltraSPARC architecture on GNU/Linux (it does on Solaris).
This means we need a different way to get metrics from a Sparc. Collectd does compile on Sparc and we can use Prometheus' collectd_exporter to accept the collectd data and expose it to Prometheus for scraping.
Setting up collectd_exporter
The devs recommend running collectd_exporter on the same machine as collectd, given how collectd_exporter is a Go project, and Docker isn't really supported on Sparc either. We can instead run it on the Prometheus host (though it can be run anywhere, really) and have collectd send its data over the network to the exporter.
We can use docker-compose by converting the docker command line from the documentation:
version: '2'
services:
  collectd-exporter:
  # accept metrics off of luxuria
    image: prom/collectd-exporter:latest
    command:
      - '--collectd.listen-address=:25826'
    ports:
      - '9103:9103'
      - '25826:25826/udp'
Configure Prometheus to scrape collectd_exporter
Next we need to update prometheus.yml to scrape information from collectd_exporter. "luxuria" is the name of my UltraSPARC server.
global:
  # omitted for brevity
scrape_configs:
  - job_name: 'collectd-exporter'
    static_configs:
      - targets: ['<collectd_exporter_host>:9103']
        labels:
          name: 'luxuria'
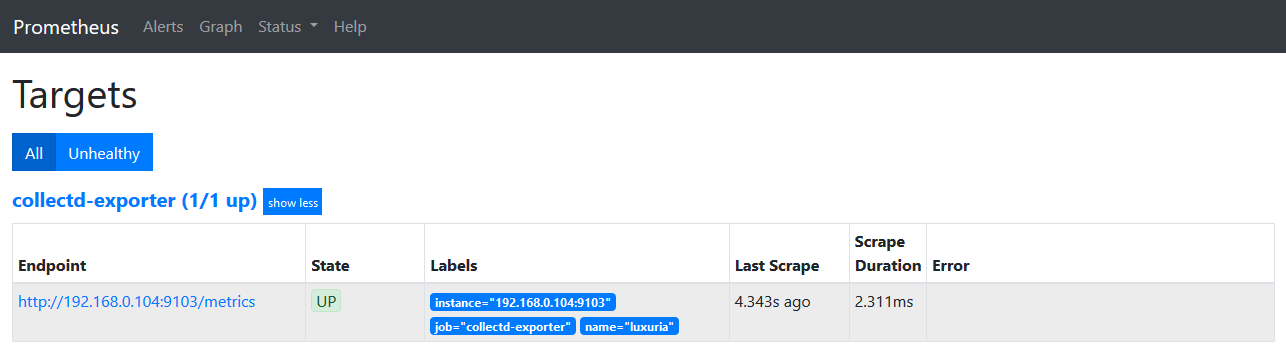
After starting the collectd_exporter container and restarting Prometheus we can already validate the connection between Prometheus and the collectd_exporter by going to the Prometheus dashboard, selecting Status and then Targets. The collectd_exporter should be listed and its State should be "UP".
Install and configure collectd
I use Gentoo on my Sparc systems due to a combination of familiarity and it offering good support for modern-ish UltraSPARC systems. As far as I'm aware the only other Linux distribution that still offers Sparc images is Debian.
To add additional plugins, the COLLECTD_PLUGINS variable needs to be
set prior to installing. The easiest way to do this is by adding it to
/etc/portage/make.conf like this:
COLLECTD_PLUGINS="$COLLECTD_PLUGINS network"
Collectd can then simply be installed with an emerge collectd.
Note that we need the network plugin to connect to the collectd_exporter, so make sure it is enabled, on top of any other plugins you'd want to enable.
We are now ready to configure collectd, uncomment the network plugin
in /etc/collectd.conf and add the following section to tell collect
to send its metrics to our collectd_exporter container:
<Plugin network>
        Server "<collectd_exporter_host>" "25826"
</Plugin>
Now we can start collectd with /etc/init.d/collectd start. With
collectd running we should see additional metrics when we visit the
collectd_exporter scrape URL
http://collectd_exporter_host:9103/metrics, these should have names
like collect_*, for example collectd_load_1 (if the collectd "load"
plugin is enabled).
If all you have are go_*, process_* and promhttp_* metrics something has gone wrong.
What tripped me up initially was that my Sparc machine's time did not match that of the Prometheus host. Setting up ntp solved that, and the metrics started flowing.
Additional notes
According to the documentation it is possible to send data from collectd to collectd_exporter using JSON over http. I did not have much luck with this approach, but once I had something working I did not pursue this avenue further.
If you do want to give this a try you'd need to enable the collectd `write_http' plugins and use a configuration like this:
<Plugin write_http>
  <Node "collectd_exporter">
        URL "http://<collectd_exporter_host>:9103/collectd-post"
        Format "JSON"
        StoreRates false
  </Node>
</Plugin>